Posted on: July 27, 2017 3
3
I’d like to thank you for viewing this report. It took a considerable amount of time to finish. I would like to apologize that parts of it may not appear formatted properly in your browser. Depending on what browser you are using- some of the images may not be visible due to the .tiff format. The original report is a PDF. I used a simple plugin to convert the document to website HTML.
If you would like to download a PDF copy of the report or prefer reading it on paper, you can download it here:
https://www.dropbox.com/s/5zgsq2kq6jri8bd/Red%20Dot%20Test%20Report%20.pdf?dl=0
There is a short video of 4 of the optics tested, demonstrating the report findings here:
https://www.youtube.com/watch?v=81X4dWcIM5c
A buddy that helped out with the data compilation actually made an interactive website where you can play with the results:
https://public.tableau.com/profile/largo.usagi#!/vizhome/optics/OpticStory
If you would like to replicate this test on your optics- you can download the complete test protocols and forms here:
https://www.dropbox.com/sh/obpot49wnlitcql/AAC6XpeK8SZq9QLBXjxXthzba?dl=0
Enjoy the report
While you read the report- check out the parallax video at : https://www.facebook.com/GreenEyeTactical/videos/1537266282979623/
Comparative Study of Red Dot Sight Parallax
Eric Dorenbush
Green Eye Tactical
Brad Sullivan
Xxxxxxx
March 2017
Author Note
Eric Dorenbush, Owner/Instructor, Green Eye Tactical
Contact: eric@GreenEyeTactical.com
Brad Sullivan, xxxxxxxx, xxxxxxxxxx
Contact: Largo.Usagi@gmail.com
This study was supported by volunteer efforts and received no outside funding sources.
** THE RESULTS IN THIS REPORT AND THE ACCOMPYING ANALYSIS AND/OR EDITORIAL ANALYSIS ARE SOLELY BASED ON THE SAMPLE GROUPS TESTED. WHILE IT MAY BE POSSIBLE TO DRAW INFERENCES TOWARDS AN OPTICS MODEL IN GENERAL– NO DATA, ANALYSIS, COMMENTS, OR STATEMENTS IN THIS REPORT SHOULD BE CONSIDERED AS A STATEMENT TOWARDS ALL OPTICS IN GENERAL AND ARE ONLY BASED ON THE SPECIFIC DATA COLLECTED AND THE SPECIFIC MODELS TESTED. **
This report is designed to evaluate the possible aiming dot deviation in red dot optic sights due to parallax effect, resulting from angular inclination or deflection in user view angles through the maximum possible angle of view on the horizontal and vertical planes. The report consists of two separate testing events: one held by the author of this report, and another from various independent volunteers across the country that replicated the test and submitted data from their observations. The results of the data collection reveal interesting trends that conflict with the commonly held notions that all red dot sights are equally susceptible to parallax induced Point of Aim deviation.
Editorial: During my years as an instructor, I have noticed a variance in the sensitivity of certain optics models with regards to Point of Impact (POI) shift due to inconsistency with the shooter’s head position and alignment behind the optic. This issue has arisen repeatedly in a specific course I teach called the Tactical Rifle Fundamentals Course (TRF). During this course, shooters are trained in marksmanship fundamentals by instructing them in various concepts that can affect the two firearms tasks: One– Properly point the weapon, Two– Fire the weapon without moving it. Obviously, there are several errors a shooter can induce that fall under one or both tasks. After data collection and custom zero development, shooters begin grouping at their custom zero distance. Depending on their barrel characteristics, measured muzzle velocity, atmospheric data, and bullet characteristics, this distance can vary generally between 24 yards to 56 yards. After initial instruction, shooters begin to fire 5 round groups at circular bullseye targets. After each group is fired, shooters move down range to the targets, and I conduct a debrief of each target, issuing feedback and sight adjustments as necessary– with the goal to increase the consistency of their grouping and to eliminate the shooter induced error. This is often a troubleshooting process that can take consecutive groups. Shooters continue this process at 100 yards, 200 yards, and 300 yards in various standard shooting positions. At the very first TRF course I taught three years ago, I noticed difficulty in completing this process by shooters using one particular optic model. The shooters using these optics produced a POI shift each group fired that could range from a quarter inch to two inches. After exhausting all mechanical error possibilities, I attempted to fire a group with one of their weapons. While adjusting my head position and assuming the prone supported position that they had been using, I noticed some irregular movement with the aiming dot in the optic. I then checked the optic by moving my head directly vertically, behind the optic while keeping the weapon immobile. It was then that I noticed that the aiming dot moved in a circular arc that was not in an axis directly equal to or opposite of my view angle. Without telling the rest of the class what I saw, I asked them to perform the same check and, when satisfied- to stand up without saying anything and let each of the other students perform the check. After everyone had completed the check, I asked the class what they had seen. They all described, independently exactly what I saw. We then performed the same actions with the other student’s optic of the same model with the same results– except for one thing– the optic moved in a completely different arc. Over the next three years, I saw many of these optic models. Without exception, every user of this optic demonstrated POI shift; every optic displayed irregular and excessive aiming dot deviation when observed; every student in each class confirmed the same observations; and, every optic displayed a different arc pattern of movement. Again, this was without exception. Over these years as an instructor, I reinforced to users of these optics at the TRF course the need to keep the aiming dot in the center of the viewing tube. I proposed the option of referencing the front sight post’s position relative to the aiming dot as a spatial reference when firing (not placing the dot on the front sight post, just noting the position relative to it) to increase consistency. Often this minimized the POI shifts, but it never eliminated it. After three years of observing the same issue with this sight and the effect it had on my client’s ability to progress with the rest of the class, I decided to disallow its use in this one specific course. I made this announcement on my company’s relevant social media pages. Shortly after sharing this equipment restriction, it was shared to an industry forum by an unknown user. My statement stirred some emotions with some in the industry. While this announcement was not an industry press release or advice to anyone in the industry, as it pertained to just one of my courses- the reaction was that it was.
In my assessment, this misunderstanding exposed a major issue in our firearms community. We have evolved, generally, into an echo chamber where broad statements and opinions drive the validity of equipment. After extensive research, I also realized the severe lack of any independent and peer reviewed testing. To a large extent, most simply take the word of manufacturers– or others take the word of another person or organization that say, “they saw it happen”. So, while my announcement was taken out of context as industry advice, I realized that it was an opportunity to, at the very least, try to do something right. Ideally, as a community, no one should react emotionally to someone who states a point of view on a piece of equipment or on a theory that differs from one’s own. One should simply request that the person substantiates their view by producing data that can be reproduced and verified. One should never discourage someone in this undertaking, for if one knows that one’s point of view is correct– then the tester’s data will prove it. If the tester’s resulting data or model is believed to be flawed, then one can, in turn, reproduce their test and demonstrate it to be inaccurate. This is the basis of the Scientific Method. Society can then keep each other honest in what individuals say because statements will need to be supported by evidence that can be replicated. Society would be improved if more people approached controversial topics in this manner. Therefore, I have committed to this endeavor by dedicating a portion of my time, without pay or incentive, to produce a test, the resulting data, and this report for the community to review. It is my deepest hope that it will drive others to reproduce what I have done, in order to either prove or disprove my results. I want to thank all who are reading this, and I hope that readers find this report to be interesting.
Eric Dorenbush
Green Eye Tactical
This report consists of two separate testing events:
The following section defines the initial test performed.
To measure and compare data on red dot sight aiming dot deviation, due to parallax, in various models of optics at variable ranges.
Users induce angular deviation in their angle of view, from one extreme to another, in order to replicate head position inconsistency and measure the maximum possible parallax deviation.
This test is intended to:
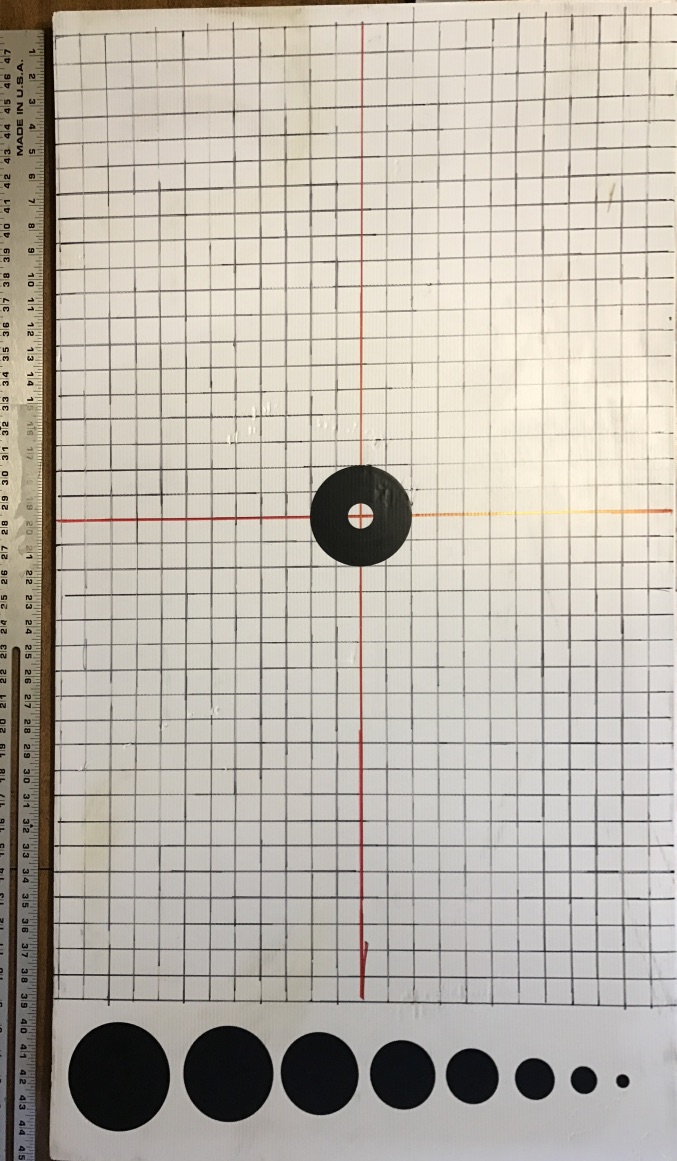
** Note: The picture above was not taken at a perpendicular angle to the target face. Due to perspective, the target is not measurable in this photograph. **
Calibration targets were constructed on white corrugated plastic target backers 24” wide x 44” tall. The lower 6” portion of the target consisted of 8 black vinyl circles that ranged from 0.5” to 4”, in 0.5” increments. The upper target area measured 38” x 24” and consisted of a marked black grid line pattern with 1” line spacing. The central horizontal and vertical lines were red. At the center of the target, was a 4” black vinyl circle with a 1” circular hole in the center.
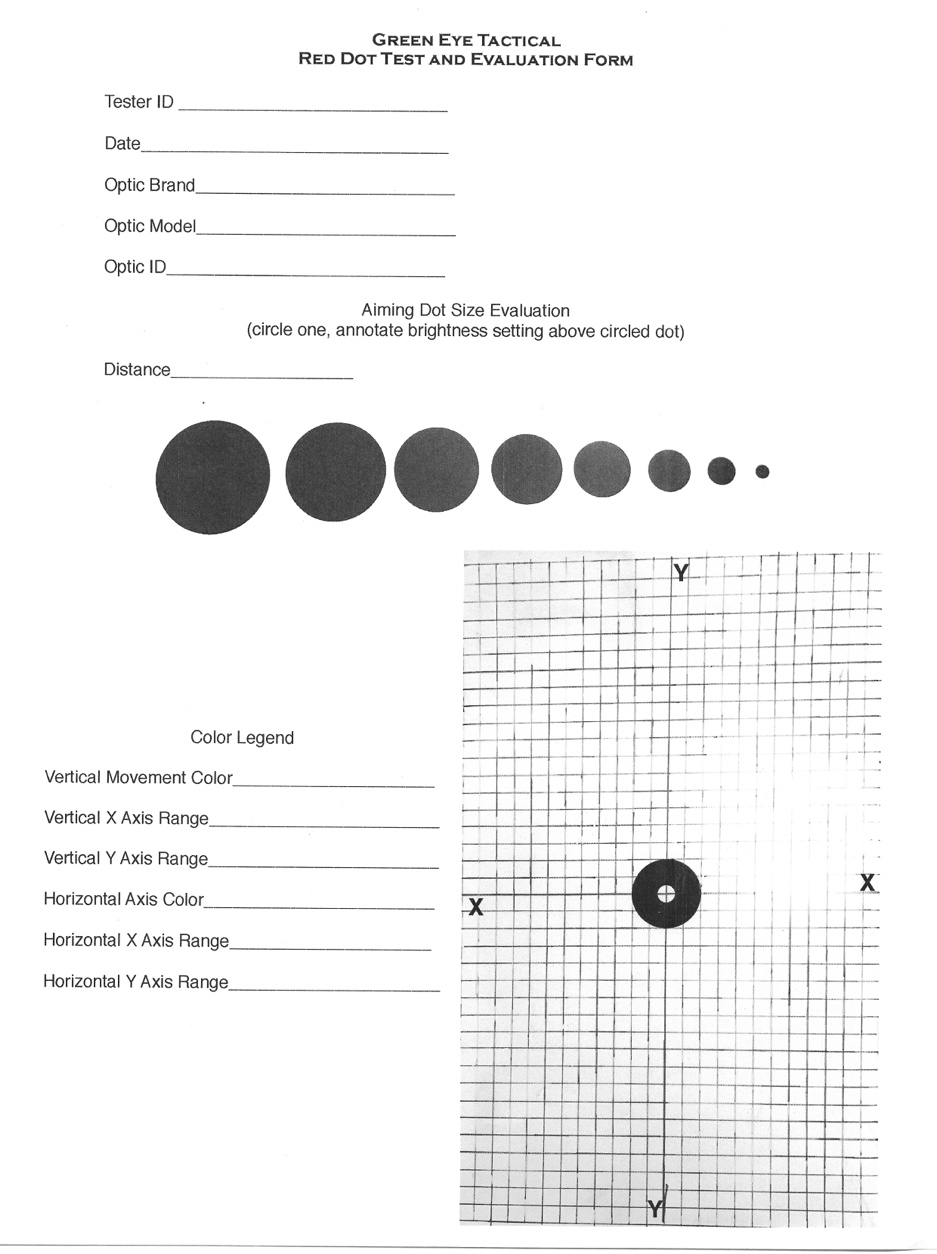
Testers were issued a testing form to be used for each optic separately at each distance observed. The concept of the form was that the tester would fill out the relevant data fields in the top margins. The tester would then use a colored pen to draw the path he saw the aiming dot move, relative to the center of the target, on the representation of the calibration target on the test sheet. The tester would use a separate color for the vertical and horizontal movement tests, noting the color used in the color legend fields. The tester would then mark the coordinates for the end points of each line trace. Testers did express some confusion as to the Cartesian coordinate system, as well as the format for an entry that separated the X axis values from the Y axis values. Testers were instructed that they could leave the coordinate fields blank and that the diagram would be used to derive the coordinates from. This format was modified in later tests.
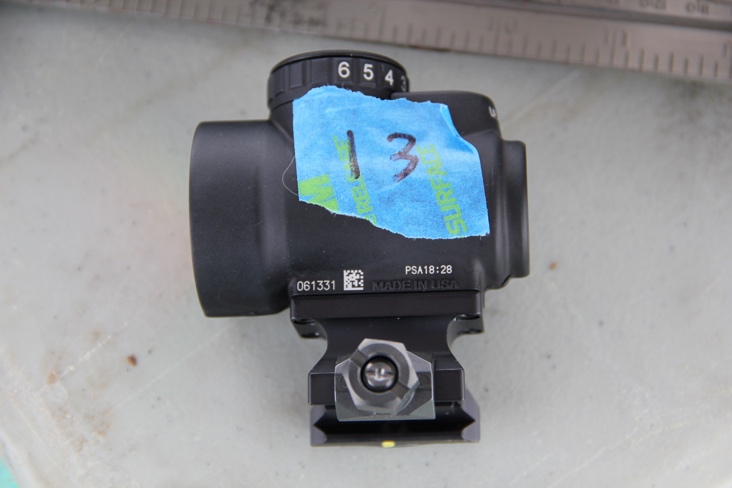
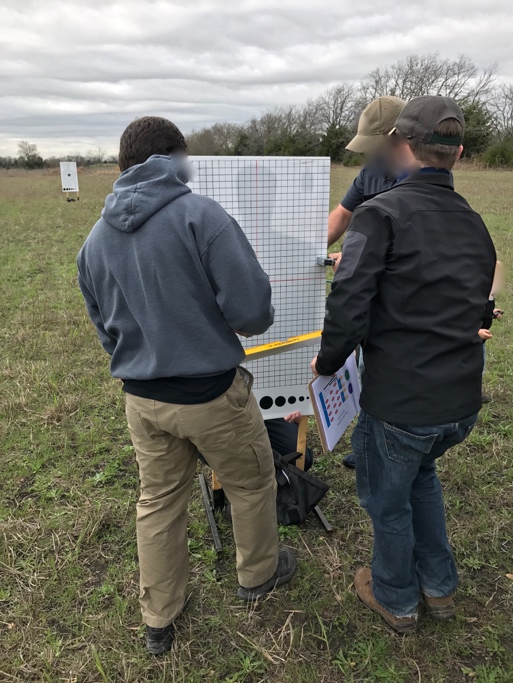
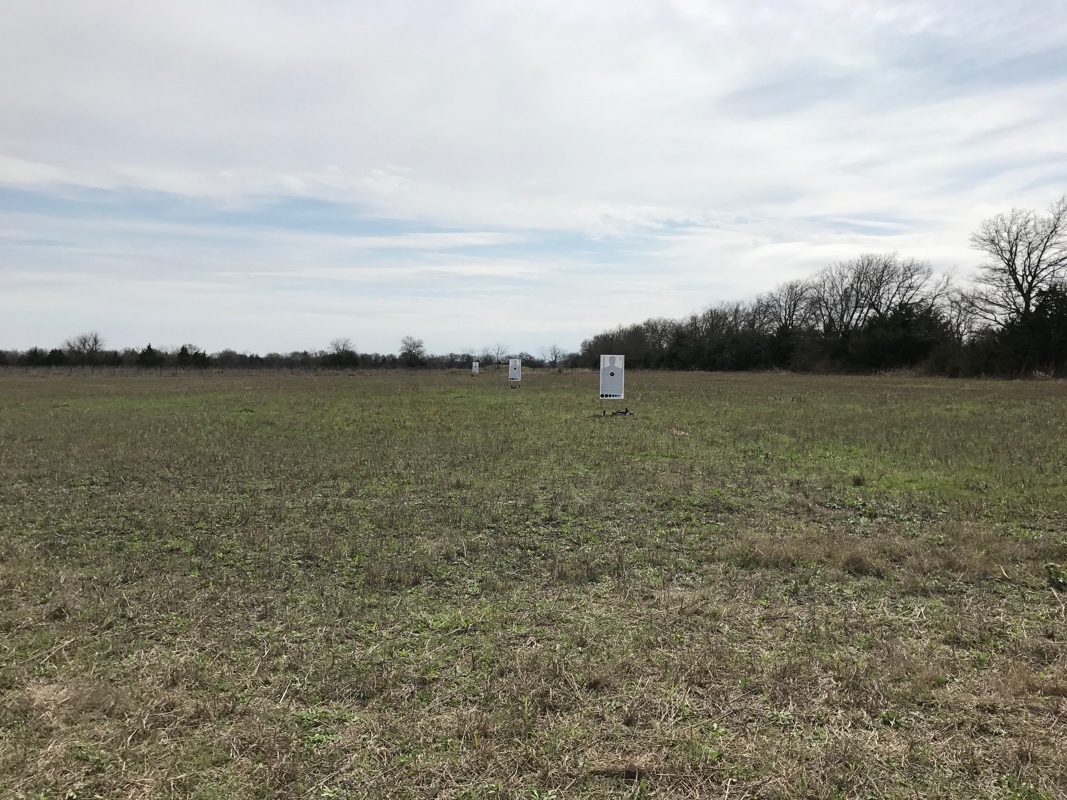
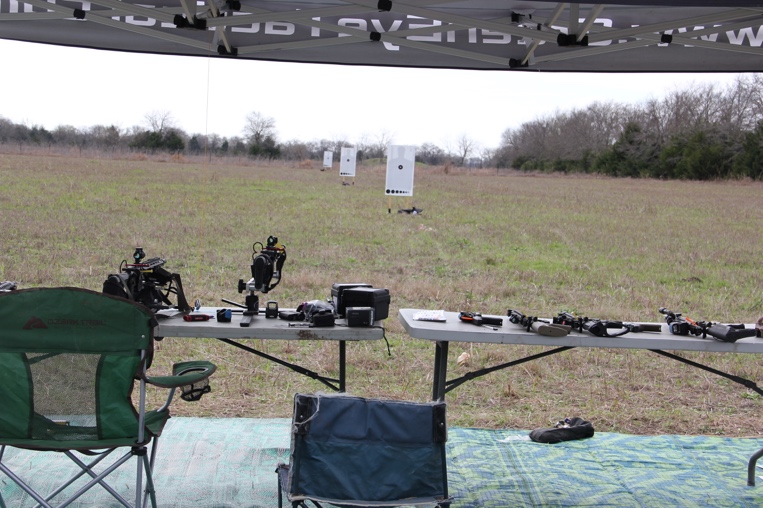
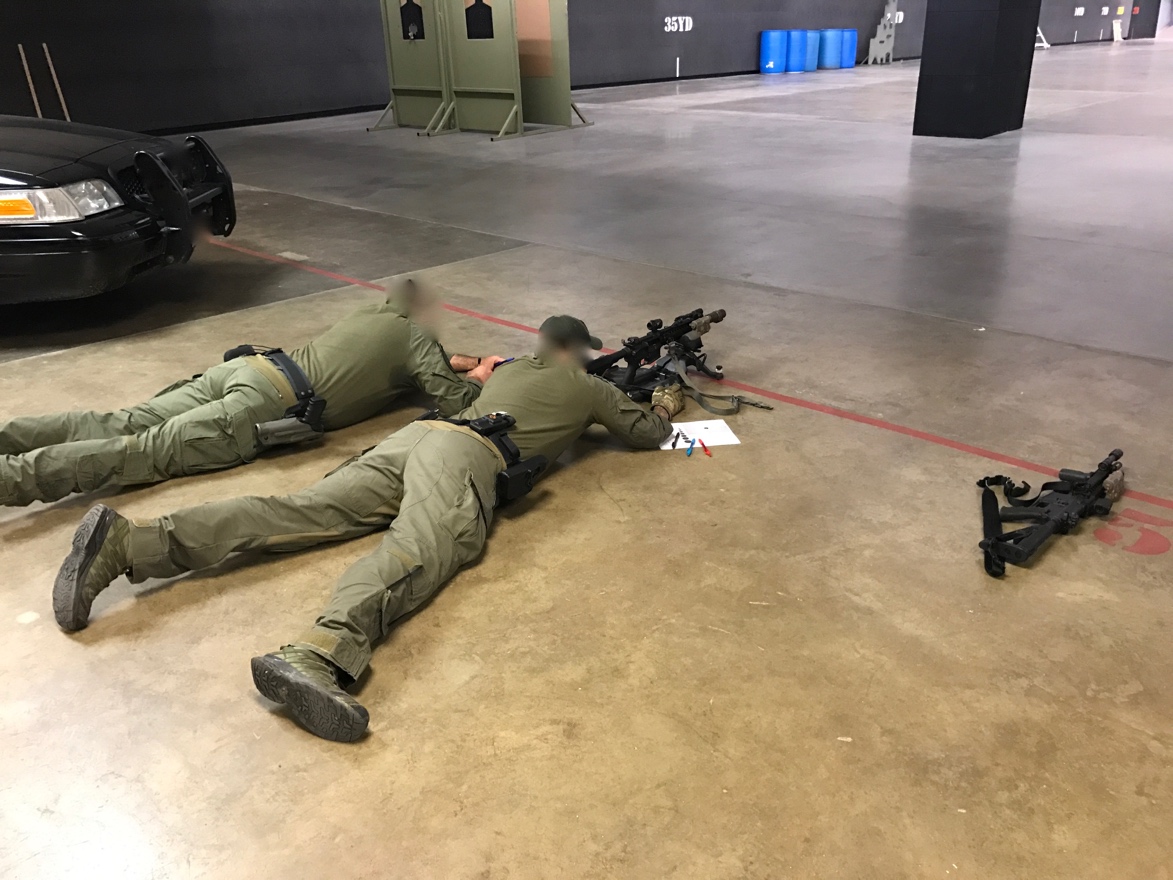
The test was held in Whitewright, Texas at a private range facility on 11 March 2017. 6 volunteer testers attended the event. 14 optics were donated for testing by volunteers. Testing began at 0930 and was projected to conclude before noon. The test began well and testers were motivated by the opportunity to contribute to the industry through data collection. It became apparent early in the day, that the protocols used were very time-consuming. By 1130, we had only finished 4 optics evaluations by 2 testers. After consultation with the lead tester, it was identified that the red dot size evaluation portion of the test was over time intensive, especially on the 100-yard target. I relayed to the lead tester, that while this was an interesting point of data to collect, it was not essential to the test’s main purpose. We also set up and additional table to provide for two additional testing stations. The holding area was decommissioned and all testers were moved to the testing line to simultaneously conduct tests. This abbreviated the process significantly, but as we were already late in the day, many testers were moving close to deadlines to depart. After consulting with the lead tester, I communicated the priority to be the 50-yard target first, then the 25-yard target, with the 100-yard target then observed if time allowed as it consumed more time. Unfortunately, due to the unforeseen time involved in the testing, not all optics were able to be observed by all testers, at all distances. It was also found that the testing form was not well thought out and the (X, Y) coordinate fields did not make logical sense. This form was subsequently modified. Testers completed an exit survey and statement before leaving. No tester reported a lack of confidence in their findings.
Often the use of terms can get in the way of explaining a concept or result. The following is a list of terms used in this report that could be misconstrued. The definitions may differ from usage in other areas, however– this is what they are being used for and where their definitions are derived from:
“Parallax is a displacement or difference in the apparent position of an object viewed along two different lines of sight and is measured by the angle or semi-angle of inclination between those two lines. The term is derived from the Greek word παράλλαξις (parallaxis), meaning “alternation”. Due to foreshortening, nearby objects have a larger parallax than more distant objects when observed from different positions……… In optical sights parallax refers to the apparent movement of the reticle in relationship to the target when the user moves his/her head laterally behind the sight (up/down or left/right), i.e. it is an error where the reticle does not stay aligned with the sight’s own optical axis” – Wikipedia, Parallax.
The key phrase in this definition is bolded. We are using parallax movement to describe the effect of the aiming point moving from its relative point of aim on a target due to the alignment of the user’s head behind the optic.
Temperature: 68F
Humidity: 57.2%
Barometric Pressure: 30.08 inHg
Altitude: 751 ft ASL
Direction of Observation: 180deg Magnetic
Angle of Observation: 0deg
|
Optic Brand |
Optic Type |
Serial # |
ID # |
|
EoTech |
EXPS 3.0 |
A1292043 |
1 |
|
EoTech |
EXPS 3.0 |
A0565568 |
2 |
|
EoTech |
EXPS 3.2 |
A1276811 |
3 |
|
Aimpoint |
T-1 |
W3229523 |
4 |
|
Aimpoint |
T-1 |
W3118077 |
Not Tested |
|
Aimpoint |
Pro |
K2980053 |
Not Tested |
|
Trijicon |
RM07 |
108157 |
Not Tested |
|
EoTech |
EXPS 3.0 |
A1348665 |
8 |
|
Primary Arms |
MD-05 |
6182 |
9 |
|
Aimpoint |
T-1 |
W3908997 |
10 |
|
Trijicon |
MRO |
041032 |
11 |
|
Burris |
Fastfire III |
12 |
|
|
Trijicon |
MRO |
0611331 |
13 |
|
Trijicon |
MRO |
010521 |
14 |
The following section summarizes the independent follow-on tests that volunteers across the country conducted by replicating the modified form of the original testing.
To collect and compare data on red dot sight aiming dot deviation, due to parallax, in various models of optics at variable range for the purpose of validating the data sets and results from the original 11 March 2017 results and to expand the sample groups.
Users would induce angular deviation in their angle of view from one extreme to another, to replicate head position inconsistency and measure the maximum possible parallax deviation.
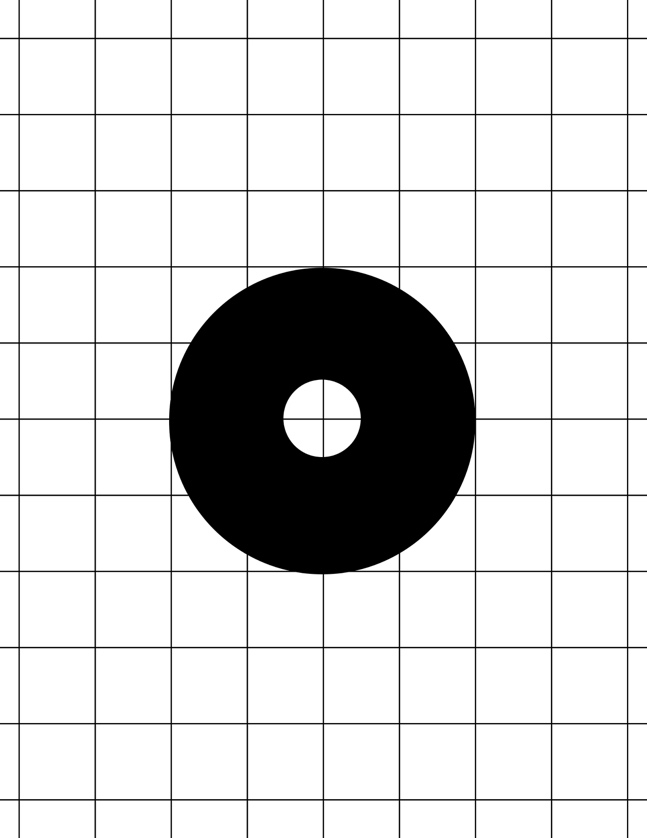
For the follow-on testing, a calibration target was produced that could be printed on standard printer paper. This modification was made in order to accommodate Law Enforcement units with limited time to construct the original calibration targets and military Special Operations Units that may be forward deployed. The calibration targets consist of the same 1” grid line spacing as the original, as well as the 4” black center circle, with the 1” circular cut out.
In order to aid and encourage the independent evaluation of the test we conducted on 11 March 17, the original testing form was modified to make the evaluation process more streamlined and easier to understand. All files were then uploaded to a shared Dropbox and the link was shared various firearms forums and on social media.
The following instruction sheet was also added to the folder. Some modifications were made to the instructions to accommodate some special operations units that wished to submit test results, but were forward deployed. Considerations for the sensitivity of releasing serial numbers of optics for some of these units:
The follow-on testing was an extremely important component of this testing report. Due to the nature of the testing procedures used in the original test, there was a reasonable chance that the tester induced error could create inconsistent results to the point that the data sets would not be reproducible. The concerns over this made it essential to replicate the test completely independently and by as many separate parties as possible. If results within the standard deviation for similar optic models could not be reproduced by independent testers, then it could invalidate the data sets for the purpose they were summarized. In that case, additional controls would have to be emplaced and the testing would need to be repeated until enough variables were removed until the data sets were consistent. All files and instructions required for the testing procedure were uploaded to a shared Drop Box folder and published on several industry forums and social media sites. As a result of this initiative, a significant amount of data sheets were received that have drastically expanded the type and models in this report, as well as drastically expanding the comparative data point of the original test. These reports have come from a wide array of individuals from a wide variety of backgrounds from the civilian, Law Enforcement, Federal, and Military community.
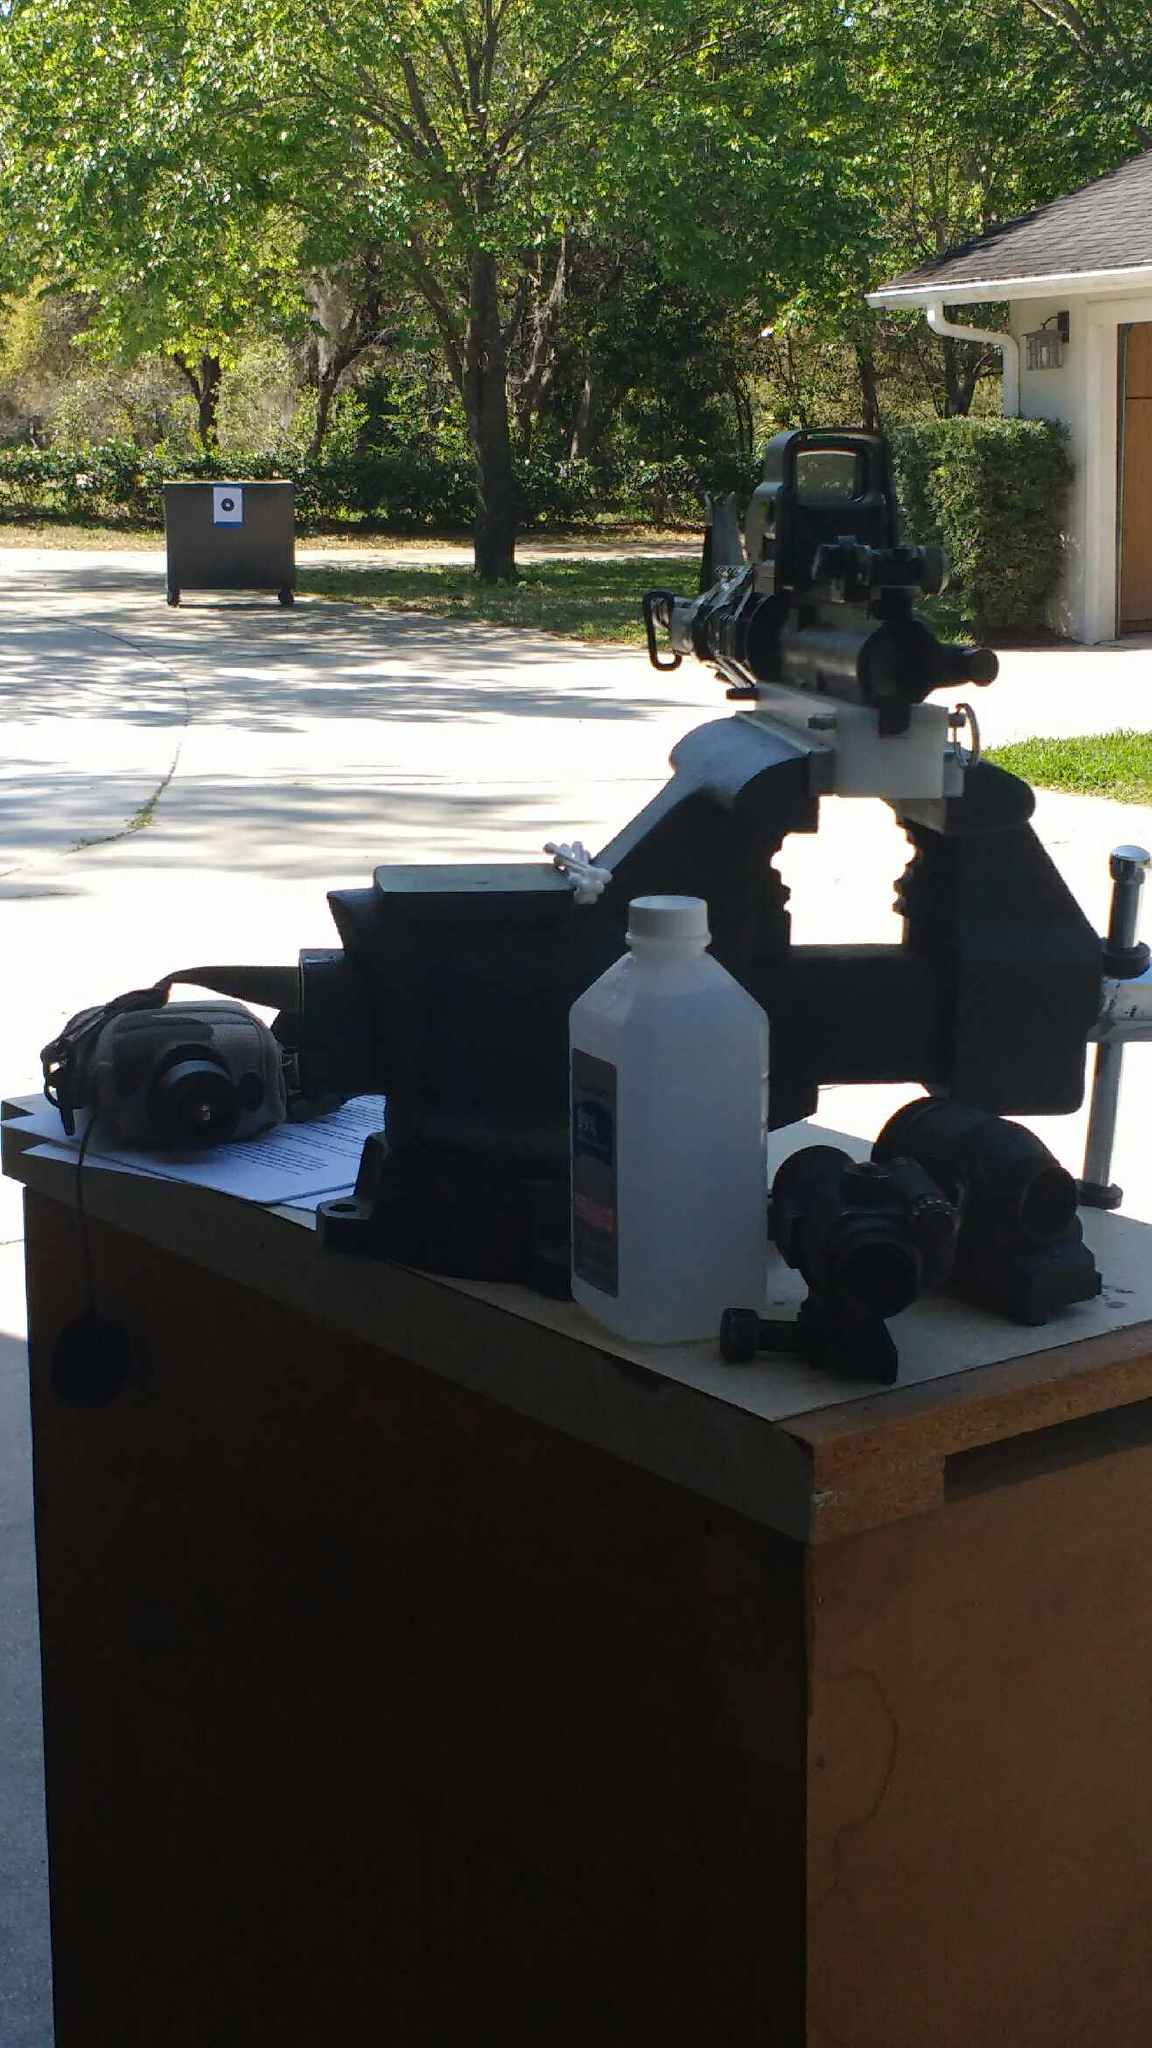
The results of these data sheets that were submitted from these independent parties are summarized in the following section and compared to the original test conducted on 11 March 2017.
For all summary charts, the following abbreviations and terms are used:
|
VD A (IN) |
Average of Vertical Deviations in Inches |
|
VD A (MOA) |
Average of Vertical Deviations in Minutes of Angle (shooter’s) |
|
VD SD (IN) |
Standard Deviation of Vertical Deviations in Inches |
|
VD SD (MOA) |
Standard Deviation of Vertical Deviations in Minutes of Angle |
|
HD A (IN) |
Average of Horizontal Deviations in Inches |
|
HD A (MOA) |
Average of Horizontal Deviations in Minutes of Angle (shooter’s) |
|
HD SD (IN) |
Standard Deviation of Horizontal Deviations in Inches |
|
HD SD (MOA) |
Standard Deviation of Horizontal Deviations in Minutes of Angle |
|
AVG A (IN) |
Average of Horizontal and Vertical Deviations in Inches |
|
AVG A (MOA) |
Average of Horizontal and Vertical Deviations in Minutes of Angle (shooter’s) |
|
AVG SD (IN) |
Average of Horizontal and Vertical Standard Deviations in Inches |
|
AVG SD (MOA) |
Average of Horizontal and Vertical Standard Deviations in Minutes of Angle (shooter’s) |
|
Vertical Deviation |
The linear measurement of the aiming dot movement, measured perpendicular to the line of sight, relative to and at the intended point of aim, as observed through the maximum viewing angle of vertical inclination and declination. |
|
Horizontal Deviation |
The linear measurement of the aiming dot movement, measured perpendicular to the line of sight, relative to and at the intended point of aim, as observed through the maximum and minimum viewing angle of horizontal deflection. |
|
Inches |
Standard linear measurement. 1/12 of a foot |
|
Minutes of Angle |
Angular form of measurement, where 1 Minute of Angle (MOA) equals 1/60th of a degree and 1 degree equals 1/360th of a circle or complete turn. True MOA subtends to 1.047 inches at 100 yards for every 1 MOA and is not used for this test. “Shooter’s” MOA rounds the subtension to 1 inch at 100 yards for each 1 MOA. This is used to simplify the math involved, the results, and to reduce confusion in some of the readers. |
|
Average |
The Arithmetic Mean as found by the sum of numbers, divided by the number of the numbers. |
|
Standard Deviation |
Standard deviation is a measure that is used to quantify the amount of variation or dispersion of a set of data values. A low standard deviation indicates that the data points tend to be close to the mean of the set, while a high standard deviation indicates that the data points are spread out over a wider range of values. The STDEV.S function is used for the calculations on this sheet. |
The premise of this test was to evaluate possible parallax error that a shooter could induce into a red dot optic through improper viewing angle, such as may occur due to inconsistent head alignment. One of the objectives of this test was to keep the manner in which the test was conducted as simple and repeatable as possible. While a more realistic way to test for possible error, would be to restrict the view angles to the center 50% of the available viewing area– placing repeatable controls to restrict this angle would have complicated the testing protocols and/or required additional equipment. For these reasons, we chose to use the maximum viewing angles on each axis of movement, as the physical construction of the tube or window in the optic would provide a natural constant for viewing angle tolerances.
Red dot users also tend to perceive and reference the aiming dots differently. This could be due to numerous reasons, such as: how users with astigmatisms may see the EOTech red dots as an ameba or separate dots rather than a single dot, or some Aimpoint dots may appear as an oval. Visual acuity can also affect the clarity of the target the aiming dot is being referenced to as well. Since the premise of this test is based on a user’s perception and ability to use an optic, it was decided to not control this variable. We feel that this makes the test unique, in that: it provides results that may more closely represent results that would be replicated by interested parties that may attempt to recreate the test. An interesting follow-up test that could be done after this test, may be to recreate this test using cameras or video equipment instead to establish a comparative data set against the user’s visual acuity and perception.
Below is a table showing the differences in the tester’s results from the 11 March 2017 test:
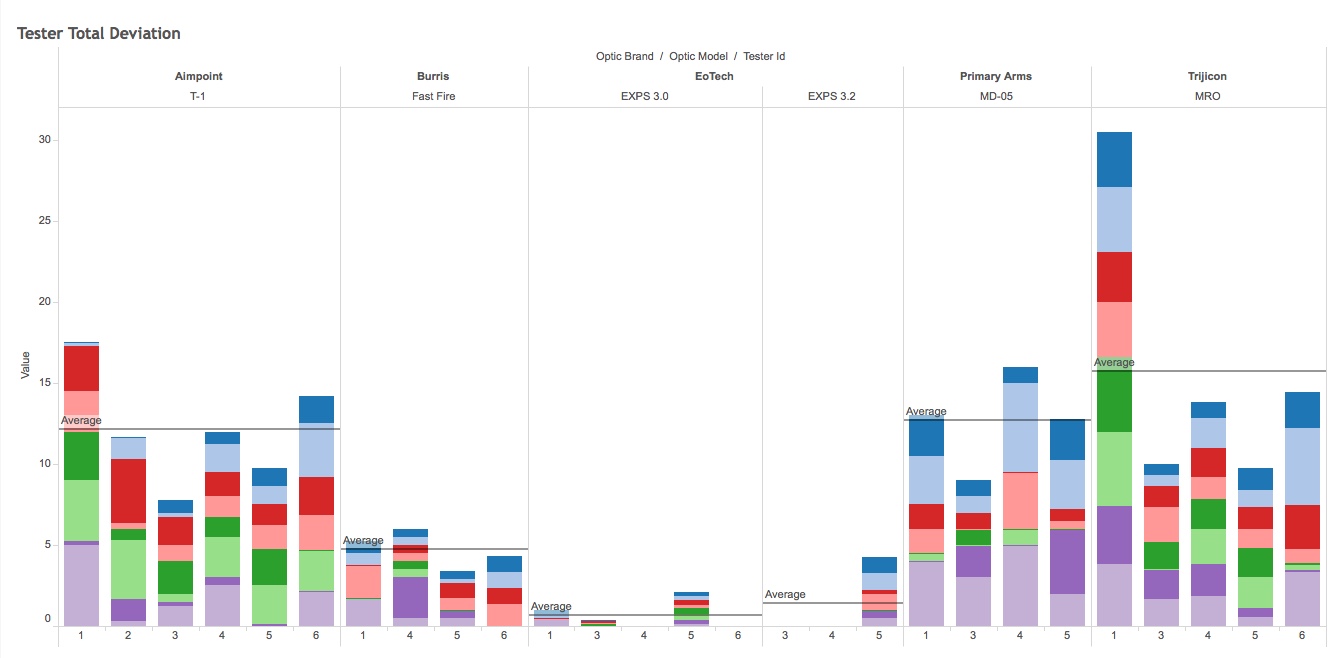
As you can see, there are variances in the results that the testers reported. What is very interesting, is that some testers reported results that were far outside the average of the other testers. However, the variance was not constant across all optics. For instance, Tester ID # 1 reported results that were far outside the average for the Trijicon MRO’s, however, the same tester was well within the average for the Burris Fast Fire and EOTech EXPS 3.0, and only slightly greater than average for the T-1.
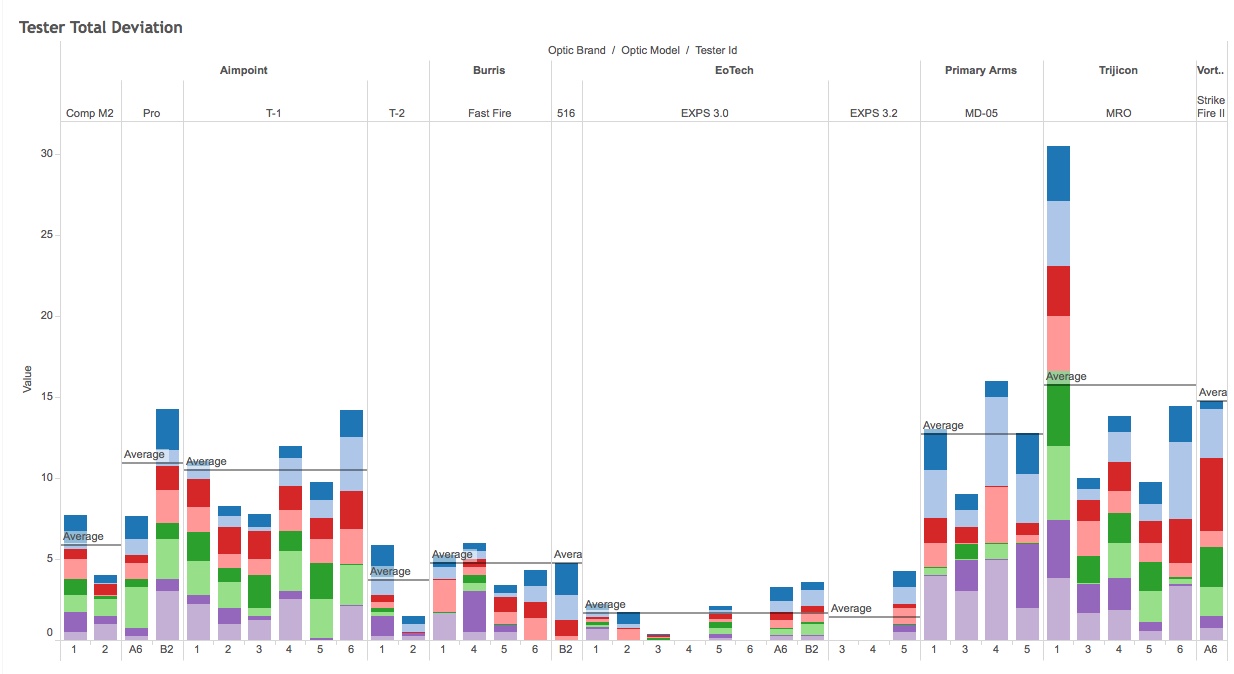
When we add in the tester standard deviations from the independent testing that occurred after the 11 March 2017 test, we can see that as the test group increases, the variance in results remain fairly consistent– tester ID # 1 on the MRO being the sole outlier. The expansion in the sample group compared to the consistency of the results seems to indicate that the original testing group’s standard deviation in data point displays a trend to be consistent with expected results.
One of the factors of the test that minimizes the effect of results that may fall outside of the margins is that we use multiple data points and present the results as averages. This results in a single large variance in data producing only a minimal shift in average results. Another statistic we included in the comparison charts that will be displayed is the Standard Deviation of the results. This gives the reader an idea of how much variance there is in the data points for the averages displayed. As the data is displayed at varying levels and orders, the reader can use the comparison
The overall section summarizes the testing data from all distanced (25, 50, and 100yds). Data sheets are entered a master spreadsheet, which can be found in the public files for this report, and results are calculated. Summary tables are sorted from better results to worse results and color coded for clarity.
The values in the “Data Points” column represent how many individual tester sheets were used to produce the results given. The “VD A (IN)” and “HD A (IN)” columns represent the average of all linear distance measured from their associated data points. The linear distance was measured by taking the line trace end point coordinates using the Cartesian Graph format (x1,y1), (x2,y2). The Cartesian version of Pythagoras’s Theorem was used to find the Euclidean Distance between the two points, using the formula:
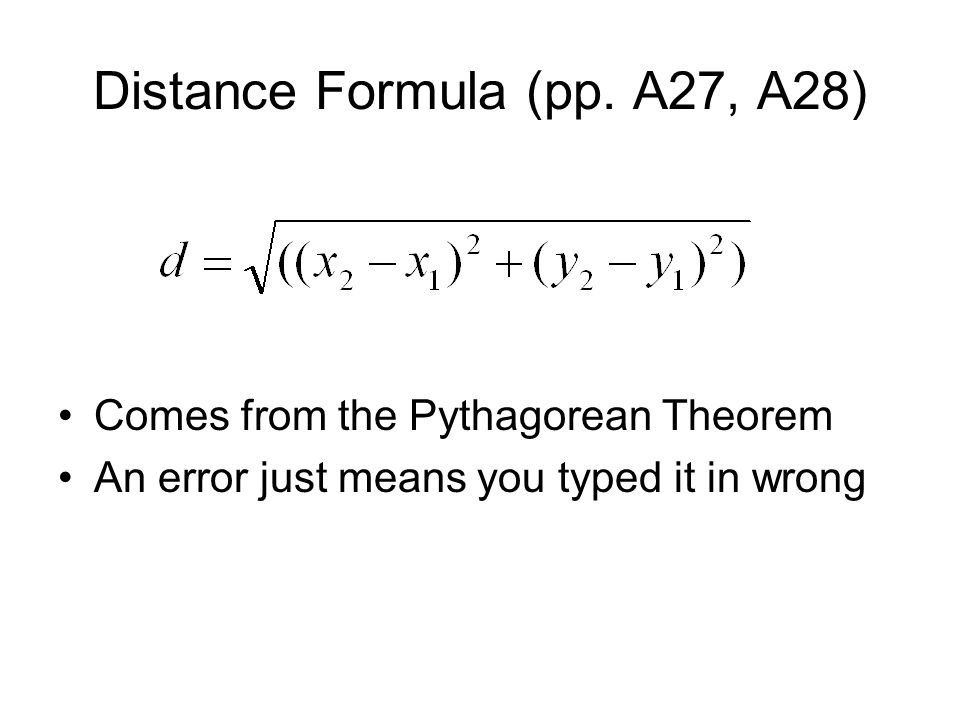
The “AVG A (IN)” and “AVG A (MOA)” Columns are a simple average of the Euclidean Distance from their corresponding deviation columns, i.e.: AVG A (IN) is the average of the VD A (IN) and HD A (IN) fields.
The Standard Deviation fields, “VD SD (IN)”, “VD SD (MOA)”, “HD SD (IN)”, and “HD SD (MOA), are not calculated from the summary charts pictured here. These values are calculated from the Euclidean Distance values from each individual optic. The average Standard Deviation fields, “AVG SD (IN)” and “AVG SD (MOA)” are averages of the corresponding Vertical Deviation and Horizontal Deviation results.
The color scheme on the charts represents an “above average” or “below average” measurement, based on a simple average of that column, represented in the “Total Sample Average” row. This means green is a smaller or more precise value and red is a larger or less precise value. The exemption is the “Data Points” column, of which a smaller number of data points is labeled as red and a larger sample size is green. Simply: green is a better result, red is a worse result.
*The movements observed are the movements of the aiming dot, reference the target, looking through the viewing window or tube. The test did not measure if parallax caused the actual perception of the targets position itself to move to changes in viewing angle. The “Vertical” or “Horizontal” descriptor to deviation describes the axis of head movement the tester used to observe the recorded results. Due to many of the optics exhibiting irregular and excessive movement, using the actual movement direction of the aiming dot was not possible. The irregular movement paths also drove the decision to use simple end points for deviation calculation, as using multiple data points along many of the optic’s curving paths would have been extremely complex. *
The “Data Points” column indicates the total number of test sheet data that were used to produce the results shown. Since all testers were not all able to test all optics at all ranges, due to having to leave as the test took much longer to conduct, the Data Points are not evenly dispersed. Keep this in mind for the later comparisons in this report, as remote testers submitted a significant number of many of these low data point optics– and their results will indicate as to whether the smaller sample group produced a flawed model or not.
The following sections below summarizes the results of the data recorded by user evaluations during the vertical movement test.
This table summarizes the results of the data recorded by user evaluations during the vertical movement test, by optic type, and at all distances. As shown, this data is derived from 107 individual test reports.
From the Vertical Deviation results, we can see a clear separation in measurements between the optic models. To further break out these results, we can compare this table to the Overall Vertical Deviation summary, sorted by individual optics tested:
As we can see from the chart comparison, the result within each individual optic type exhibited relatively consistent behavior when compared to the same models. The exception being the MRO’s, where we see that one of the three MRO models, Optic ID # 13, significantly outperformed Optic ID # 14 and 11. These optics, however, still performed in the bottom 50% of the group.
Many of the testers reported very minimal movement observed in the EXPS 3.0s tested, and if movement occurred– it was at the very edge of the viewing window and was minimal.
The MRO was very difficult for the users to diagram what they saw. Most testers reported a diagonal deviation when moving their point of view vertically. The difficult part to describe was when the aiming dot passed back through the target as the tester crossed over the center of the viewing tube. At this center point, the dot would make a sharp movement before continuing its diagonal path. Some users described a “squiggle”, some a lightning bolt, some a waveform. This behavior was observed by all testers on all MROs tested in this test. To demonstrate this, below is a picture of Optic ID #13’s movement diagram at 50 yards, as drawn by Tester # 5. To remind the reader of perspective– the black circle represents the 4” black circle on the calibration target and grid lines are 1” spacing.
Testers reported varying semi circular movement patterns in the T-1s tested. All testers reported this behavior in both T-1 optics tested. An example of the irregular movement observed in the T-1 models is exhibited below in Optic ID #the ’10s 50 yard test form as observed by Tester ID #1.
We also see the formation of a trend, that will continue through the varying levels of breakout detail, that the optics that exhibited less aiming dot deviation due to parallax also produced a better standard deviation of results. The decrease in movement seems to indicate that testers had the ability to more accurately observe and reference these optics.
Editorial analysis: As an instructor, I find the Standard Deviation numbers almost more interesting than the Deviation measurements, as it clearly points to which optics are more sensitive to user error. As it pertains to user error, an optic with a very low standard deviation would indicate consistent error that could be predicted and more easily account for, a very high standard deviation indicates inconsistent error that would be much more difficult to account for.
From the Overall Horizontal Deviation by the model type summary chart above, it is observed that there were only changes in rankings in the upper 50% of the optics, compared to the vertical movement test. Some of the MROs appeared more sensitive to horizontal head movement, while the T-1s were more sensitive to vertical head movement, but this was not consistent.
We can also see the trend of a greater precision of results with the optics that exhibited less deviation.
In the same chart that shows the same summary, but broken out to individual optics tested we can see some interesting trends. For instance: Optic ID #10 displays more consistent standard deviation result of 3.5 MOA in the horizontal test, and a less consistent standard deviation result of 5.27 MOA in the vertical testing.
Editorial analysis: This data, combined with the tester’s verbal descriptions of what they observed, demonstrate how irregular movement paths can cause difficulty with the user’s ability to consistently reference the optic.
As we can see from the summary chart there is a wide range in deviations with very large increments between many of the optics models. While we generally accept that red dot optics are all subject to parallax, it is extremely clear that some optics do not succumb significantly to parallax deviation and other optics exhibit more extreme parallax deviation.

In this chart, we see that 50 data sheets were available and used to produce the summaries for the 25-yard results. While some optics types had fewer data points, they do show a level of consistency within the larger sample size of data points in the overall summaries. We also see a general consistency in the rankings of the optics tested.
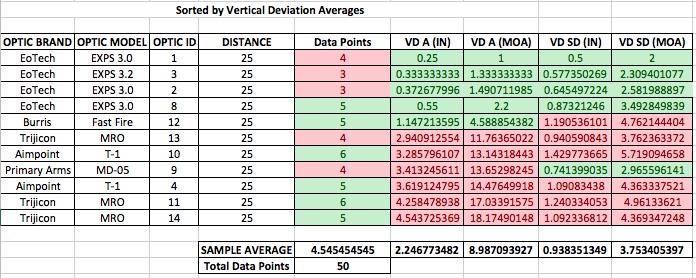
When we break these results out by specific optics tested, also see some level of consistency compared to the overall summaries of all distances. We do see some minor changes in rankings within the rankings of optics types, as we do with the EoTechs which have changed positions in rankings within themselves– but have retained their overall place within the group by type. We also see MRO Optic # 13 significantly outperform #14 and #11. The Burris remains unchanged in its position, but the T-1s have changed position relative to each other and the rest of the lower 50% of the sample group.

In the 25 yard summary by optic type for the horizontal deviation test, we see the same general trend towards ranking. The top 50% ranking remains unchanged from the overall results at all distances. The same optics that changed position within their respective types, changed in line with their change in the overall results. It is of note– that the EXPS 3.2 begins to display a worsening degree of standard deviation of results at closer distances.
When broken out by specific Optic ID #, we again see the same trend for positions compared to the summary results from all positions. Again, the EXPS 3.2 displays a worsening degree of standard deviation here as well.

While the average results at 25 yards, by optic type, remain consistent with the rankings in the summary results from all distances in the previous section– the standard deviations do not.
We also see some changes in specific optics rankings within their respective optics types, compared to the summary chart of all distances. The constant we do see is that the optics in the top 50% and the bottom 50% of ranking, remain in their respective brackets.
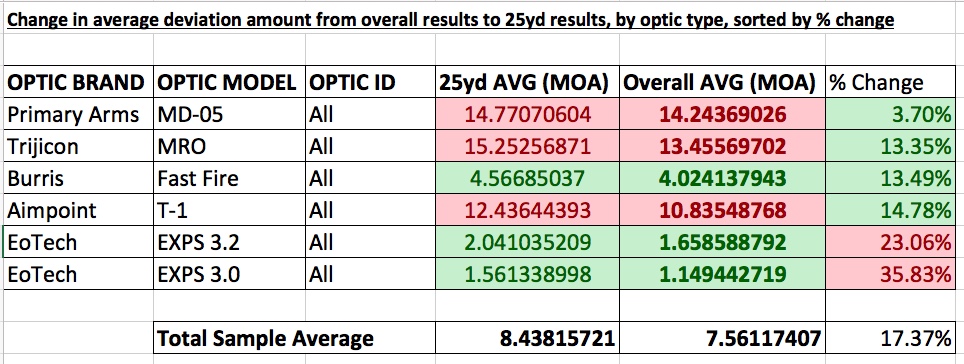
Another interesting trend is that there is no apparent constant, with regards to any general rule as to whether all red dot optics tested displayed an increasing or decreasing degree of parallax deviation at closer distances than at longer distances. It is generally assumed that red dot optics are more susceptible at closer distances than at longer distances. While we do see that all optics displayed more angular (MOA) deviation at closer distances, there is not a constant rate of change. The optics that displayed significantly less deviation at closer ranges displayed a drastically higher rate of increase. The optics that displayed significantly higher angular deviation at closer distances displayed a significantly lower rate of increase. However, none of the optics displayed any form of a constant of change when compared with other optics models.

The 50-yard vertical evaluation averages, by optic type, remain consistent with the ranking positions in the similar overall results at all distances. With exception to the Primary Arms optic, which drops to the bottom slot.
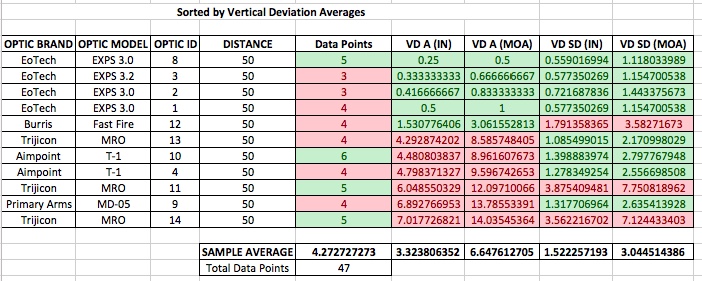
The breakout detail by Optic ID # shows the same marginal changes between rankings between optic types and similar changes in the lower 50% rankings. The Burris remains at a constant position.

The horizontal deviation table remains almost consistent with the changes observed in the vertical summary changes.
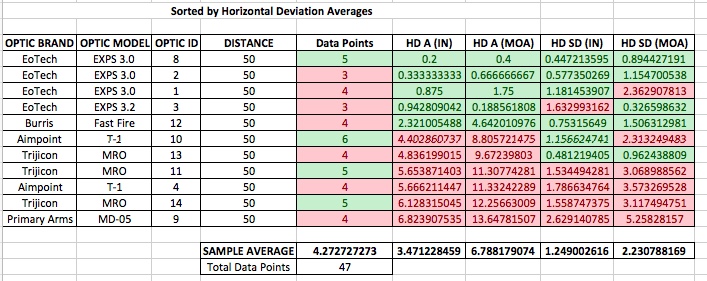
The breakout detail, by Optic ID #, again show consistent results with the previous averages with the top 50% remaining constant and the bottom 50% marginally changing rankings.

The 50 yard summary data (of the 47 available data sheets), by optic type in the table above continues to display general consistency with the overall results. We do however see the Primary Arms optic fall in rankings in the vertical deviation table.
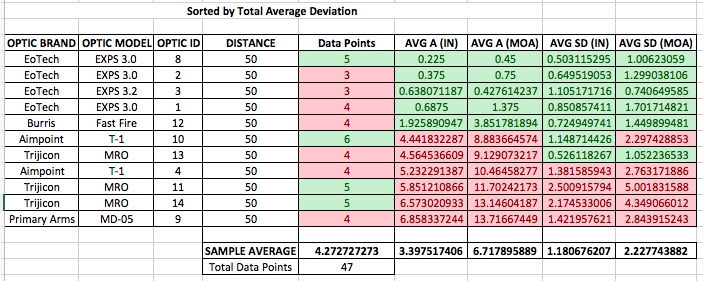
The by Optic ID # breakout follows the same ranking change trend as the vertical and horizontal chart changes for the 50 yard results
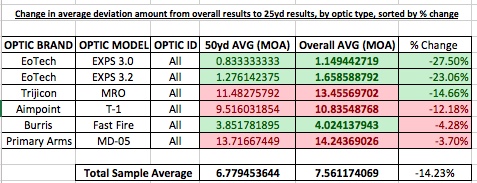
As before, we see the lack of a constant rate of change in deviation as we move back in distance to 50 yards, compared to the overall summary of all distances. Here, even though he deviations were minimal, to begin with, we see the EoTechs drastically decrease the percent change in parallax, compared to the other model types that show a very large amount of deviation and a small rate of change. This is an interesting data set that challenges the notion that red dot optics are either parallax free beyond 40 or 50yds or that the amount of parallax decreases with distance. It also challenges the notion that parallax affects all red dot optics in the same way or in any consistent fashion when compared to models.
Unfortunately, the 100 yard summary has the smallest sample size. This test was done towards the end of the test day and due to the level of precision in aiming, took significantly more time to conduct.

In this chart, we see a different color. The yellow blocks result from the fact that there is only one data point for that model. A standard deviation cannot be determined from one data point. The general ranking of the optics models, with regards to the vertical deviation from the 10 data points, remain consistent with the overall results, regardless of the small sample size.

Compared with the overall summary of all distances, the vertical deviation results at 100 yards remain relatively consistent. It is interesting that there was no consistency between the MRO models. From the data we collected, the MRO optic type displayed the least consistent observation results when compared to the other models. The extreme shift that was observed in Optic ID # 11 was confirmed by two separate observers as represented in the data points and the relating movement diagram drawn by the observers. While we do not have an even number of data points with all the optics on this chart, there is an extreme difference between the top optics and the bottom optics. The results of the MROs and T-1s were a great surprise to the testing group, who expected parallax to decrease significantly at further distances as the EOTech did.

Again, we see consistency in the relative rankings compared to the overall summary charts.

As we break out the results here by Optic ID number, we see that some of these optics showed a very large increase in deviation when the testers observed for movement while adjusting their horizontal viewing deflection as opposed to the previous chart that displayed the results from the users adjusting their vertical viewing angle. Specifically startling were the observations from Optic # 11, which testers reported that the aiming dot nearly moved completely outside of the 24” wide calibration target at 100 yards.

The average table for 100 yards, by optic type, shows a very clear separation in deviation amount between the four optic types. Testers were very surprised by the Burris during the whole of this test, but especially at 100yds– considering it is a micro red dot and not generally considered in the same class as the larger optics in the test that are more commonly employed at this distance.

The by-Optic ID # breakout continues to fall in line with the ranking trends of the overall summary of all distances, with the same effect of the lower ranking optics changing position.

The percentage change in angular deviation generally falls into what is commonly understood, that optics are less susceptible to parallax at longer distances. However, as before, the change was not linear and varied greatly between the optic models.
The results of this test are representative of independent tester evaluations, solely of the specific optics that were tested, under the conditions tested. They cannot be construed to represent all optics produced under these model lines. While the various optics of the same model type have large differences in the sequential numbering of their serial numbers and most probably indicate a significant difference in production dates– there is insufficient data to draw conclusions or comparisons between production years.
There is one interesting fact of this test that has not been addressed during this test report. That is, whether the optics that were tested– that have excessive and irregular parallax deviation could be sent back to the manufacturer for repair. That brings us to one specific optic in this test. This optic was donated for testing by a volunteer that could not attend the testing. The owner of this optic had noticed first-hand, irregular and excessive aiming dot movement. These errors presented both visually, and through POI shift during consecutive groups. This owner contacted the manufacturer directly about this issue and requested resolution. The manufacturer agreed to an RMA and the owner sent the optic to the manufacturer. The owner received an email confirmation that the optic was received and then later that it had been fixed. The owner then received the optic in the mail. This optic was ID #10, and Aimpoint T-1. Unfortunately, Aimpoint would not disclose to the owner what parts were repaired, altered, or replace. It was not disclosed to the client what, if any, physical defect was present.
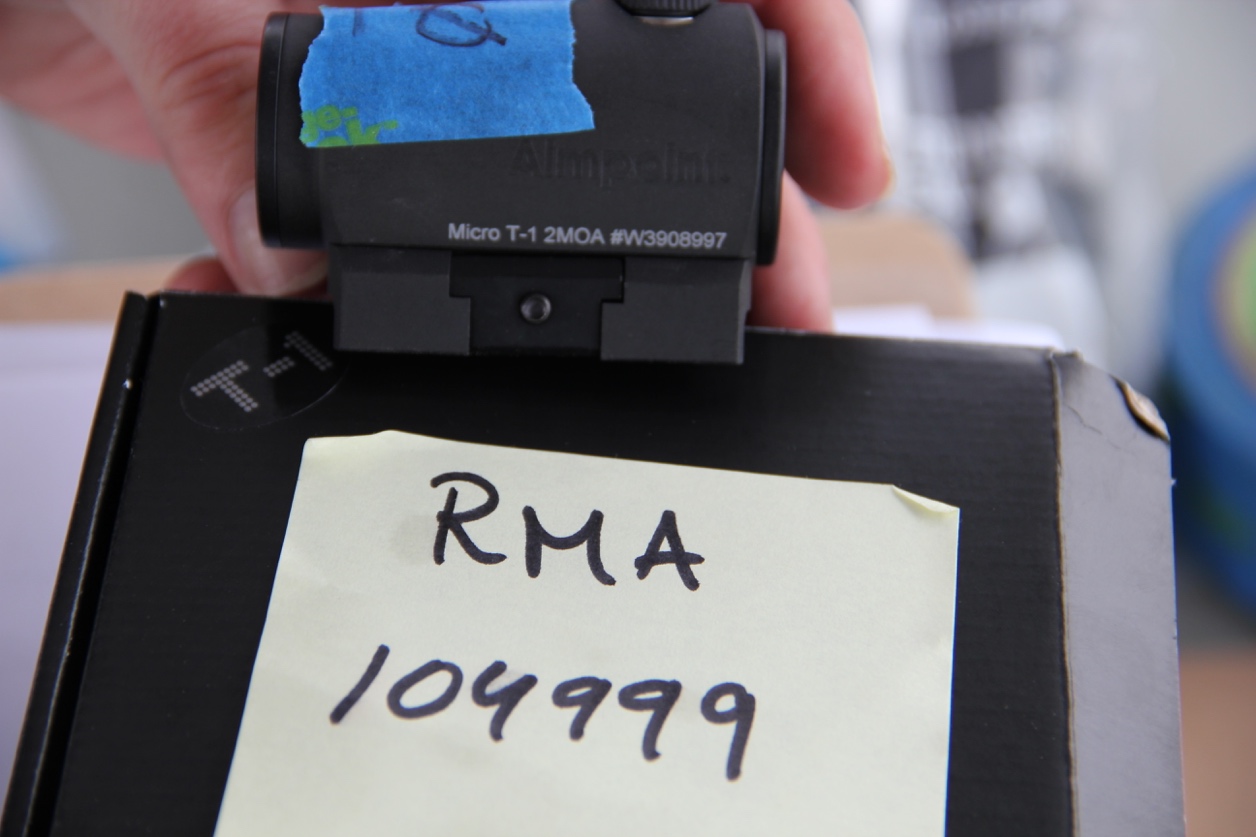
This specific optic’s deviation was measured, overall, by 15 separate data points as opposed to 10 data points to the other T-1 tested with 10 separate data points. The overall results of this optic that had been repaired by Aimpoint differed to the non-repaired T-1 by 0.135327493 inches of Average Overall Deviation and 0.064025083 inches of difference in Standard Deviation in inches in the overall summary results.
Both the testing group and I are confident in the results we have recorded and we are releasing all raw data and calculations, to include: tester sheets, photographs of optics and serial numbers, testing conditions, protocols, and procedures used. The intent is to be as transparent as possible and afford the ability to independent and interested parties to not only confirm the summaries represented in this report, but also so that the test can be replicated independently with other optics of the same type and model so that the results here can either be confirmed, corrected, or disputed. We encourage others to do so and welcome the results of their outcomes.
After the initial testing that we hosted, we published the testing procedures and invited anyone who was willing to replicate the testing with their own optics. The independent remote testers then submitted their testing forms and they were added to the results. The following section summarizes the data that was submitted and compares it to the original testing.
Vertical Deviation, Follow-On Test
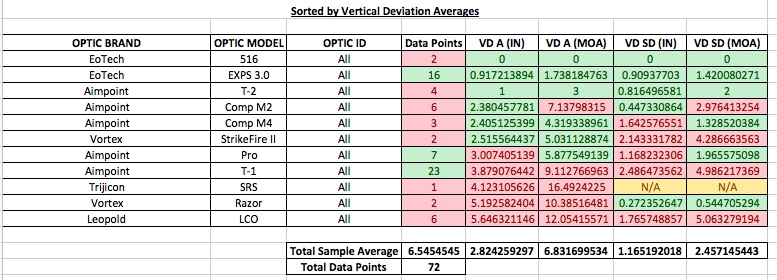
This table summarizes the results of the data recorded by user evaluations during the vertical movement test, by optic type and at all distances. As shown, this data is derived from 72 individual test reports.
Vertical Deviation, All Tests
This table represents the combined data from the Original and Follow-On tests and is comprised of 179 data points. The only two optics that are common between the Original tests and the Follow-On tests are the EOTech EXPS 3.0 and the Aimpoint T-1, which both show fairly consistent results between the respective tests. We also see that there is a drastic performance difference between the Aimpoint T-1 and T-2, with the T-2 performing almost as well as the EXPS 3.0.
From the Vertical Deviation results, we continue to see a clear and consistent separation in measurements between the optic models.
Horizontal Movement, Follow-On Test
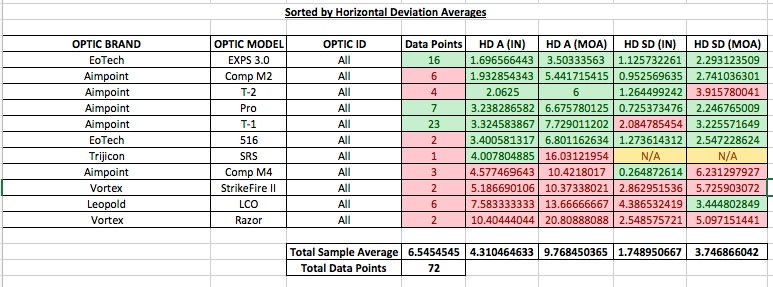
From the Overall Horizontal Deviation by the model type summary chart above, it is observed that there are changes in rankings with many of the optics, however, the EXPS 3.0 and the T-2 remain in the top of the rankings. The EOTech 516 tested showed significantly more sensitivity to horizontal head movement than vertical head movement, as did the Aimpoint Comp M4 and the Vortex StrikeFire II.
Horizontal Movement, All Tests
The table above shows the Horizontal Deviation test results from both test series. Again, we can see the trend of a greater precision of results with the optics that exhibited less deviation continuing, as it did with the original tests.
Total Average Deviation, All Tests
Total Average Deviation, Follow-On Test
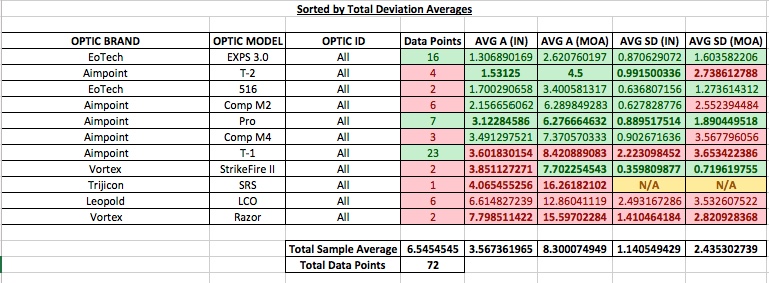
The two charts above compare the overall results of both tests (above), and the follow-on test (below). Comparing the two charts, using the data from the two common optics models (EXPS 3.0 and T-1)– we can see a measure of consistency between the tests. In the follow-on tests, the EXPS 3.0’s results only differed by 0.020680957 inches in standard deviation. The AimPoint T-1 only differed by 0.441285131inches in standard deviation between the results. The Leopold LCO surprised all testers involved with its large degree of diagonal movement.
25 Yard Vertical Deviation, Follow-On Test
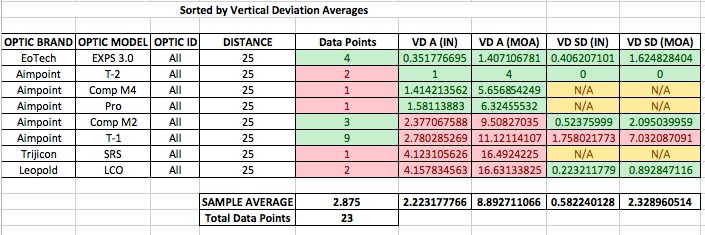
In this chart, we see that 23 data sheets were available and used to produce the summaries for the 25-yard results. Unfortunately, there were a few optics models that only have one data point, that was submitted by remote testers. These are evident by the “N/A” in the Standard Deviation fields, as a standard deviation cannot be derived from one result.
25 Yard Vertical Deviation, All Tests
Regardless, the chart above of the overall test results remain consistent with model ranking. The Trijicon and Leopold models tested showed a significant amount of movement at 25 yards, exceeding 4 inches (>16MOA). This may be a concern for end users that may not be able to precisely keep the aiming dot in the center of the viewing window consistently due to CQB environments, NVG use, or Protective Mask use. On the other hand, the EXPS series and the T-2 show a level of viewing angle forgiveness that is measurably superior to the lower ranked models.
25 Yard Horizontal Movement, Follow-On Test

In the 25 yard summary by optic type for the horizontal deviation test (above), we see various changes in position. The only two optics that performed slightly better in the horizontal viewing angle test were the T-1 and SRS, the rest performed a bit worse- to varying degrees.
25 Yard Horizontal Movement, All Tests
When the horizontal deviation results from the follow-on tests and the original tests are combined in the chart above, we continue to see the previous trends of rankings.
25 Yard Total Average Deviation, Follow-On Test

Above we see the total averages for the Follow-On tests, which show a level of consistency in rankings for most optics– except for the Comp M2 and Comp M4 which move around depending on how the data is broken out– as they showed more or fewer degrees of sensitivity to horizontal head movement.
25 Yard Total Average Deviation, All Tests
The combined testing results above, compared with the combined results of the vertical and horizontal testing show that there were only four optics models that maintained an amount of movement that was less than 2 inches at 25 yards: the EXPS 3.0, EXPS 3.2, T-2, and the Fast Fire.
However, we do see that there is no consistency between the models with the generally perceived “rules” with regard to parallax at closer distances. The charts below demonstrate this:
25 Yard % Change, Follow-On Test
25 Yard % Change, All Tests
The chart above displays the % change in deviation at 25 yards, as compared to the average results at all distances– while the chart below it shows the same for the combined results of the original and follow-on tests. We do see that no optic model displayed less parallax at closer range. However, we also see that the amount of change between the optics models show drastically differing increases in parallax. Some optics models showed negligible increases in movement, while others increased by more than 50%.
Another interesting trend is that there is no apparent constant, with regards to any general rule as to whether all red dot optics tested displayed an increasing or decreasing degree of parallax deviation at closer distances than at longer distances. It is generally assumed that red dot optics are more susceptible at closer distances than at longer distances. While we do see that all optics displayed more angular (MOA) deviation at closer distances, there is not a constant rate of change. The optics that displayed significantly less deviation at closer ranges displayed a drastically higher rate of increase. The optics that displayed significantly higher angular deviation at closer distances displayed a significantly lower rate of increase. However, none of the optics displayed any form of a constant of change when compared with other optics models.
50 Yard Vertical Deviation, Follow-On Test
The 50-yard vertical evaluation averages, by optic type, for the Follow-On tests have almost twice the data points as the 25 yards results do. This gives us the ability to have a standard deviation value for all but one optic.
50 Yard Vertical Deviation, All Tests
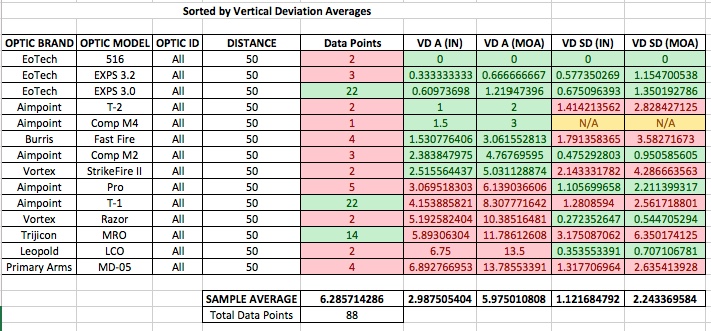
The chart above, showing the combined results, begins to show a trend in rankings– with the EXPS series and the T-2 consistently towards the top and the MRO and LCO towards the bottom. The T-1 remains in the bottom half.
50 Yard Horizontal Movement, Follow-On Test
The horizontal deviation table for the Follow-On tests shows that the EOTech 516 remains more sensitive to horizontal head placement than the other EOTech models, as does the Aimpoint Comp M4. The Leopold LCO and the Vortex Razor both more than double their amount of deviation at 50 yards, compared to 25 yards.
50 Yard Horizontal Movement, All Tests
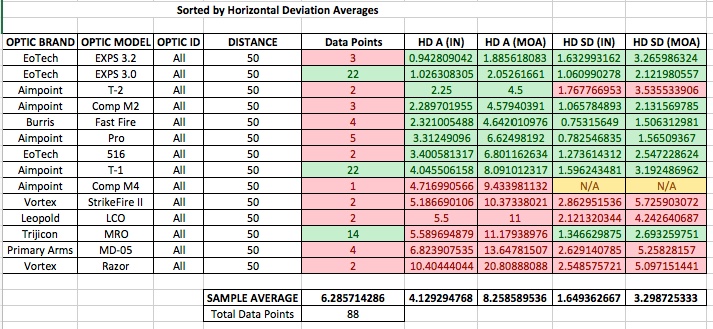
The overall horizontal deviation results continue to show a consistency of rankings with some of the optics. We also see that the Primary Arms optic almost doubled its movement from 25 yards to 50 yards. We also see the trend of that most of the optics display more parallax movement when the viewing angle changes horizontally, as opposed to vertically.
50 Yard Total Average Deviation, Follow-On Test
The 50 yard summary data (of the 41 available data sheets), by optic type, of the Follow-On testing in the table above continues to display the relative stabile top positions in rankings of the EXPS 3.0 and the T-2. The T-1 continues to be in the bottom 50% of the rankings with over twice of the movement of the top optics.
50 Yard Total Average Deviation, All Tests
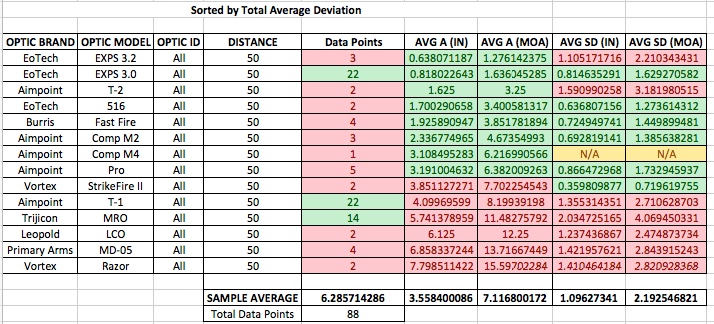
The 50 yard summary of both test groups outlines the misconception that most red dot optics are “parallax-free” at 40- 50 yards (depending on manufacturer’s claims). The Trijicon, Primary Arms, and Leopold models tested show the capability of almost to more than 6 inches of aiming error at 50 yards due to head position misalignment. These errors stand in stark contrast to the EXPS series and the T-2, which both present much less error– even with the extreme range in viewing angles used for testing.
50 Yard % Change, All Tests
50 Yard % Change, Follow-On Test
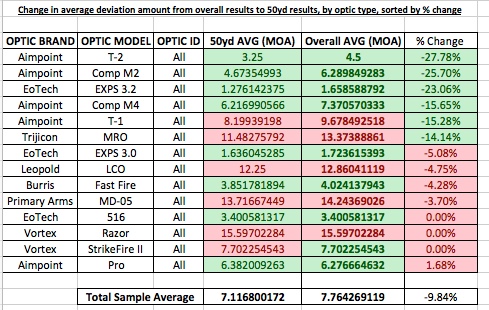
As before, we see the same lack of a constant rate of change in deviation for the Follow-On tests as we move back in distance to 50 yards, compared to the overall summary of all distances. We do see the trend for all of the optics to generally display less movement at 50 yards, as opposed to at 25 yards, but again– the rate of increase/decrease is not consistent between models. One correlation is that the optics that display less overall movement, also display much more of a consistent amount of change in movement at variable distances.
Unfortunately, again, the 100 yard summary has the smallest sample size. This test continues to be the most tedious to conduct due to the precision of aiming required. The results are, nonetheless, interesting.
100 Yard Vertical Deviation, Follow-On Test

In this chart we see the EoTech EXPS 3.0 display very little movement at 100 yards. The T-1 and LCO display a significant amount of error.
100 Yard Vertical Deviation, All Tests

Compared with the overall summary of all distances, the vertical deviation results at 100 yards are surprising. Although there is only one testing data point for the Fast Fire, the tester reported no movement, whatsoever. The LCO exceeded 6 inches of movement, the T-1 exceeded 8 inches and the MRO exceeded 9 inches.
100 Yard Horizontal Movement, Follow-On Test

Again, at 100 yards, we see the tendency of all the optics tested to be more sensitive to horizontal head position than the vertical head position.
100 Yard Horizontal Movement, All Tests

The sensitivity of the horizontal head position that we see in the optics tested show that the MRO tested is capable of inducing enough aiming error, due to head alignment issues, to miss an IPSC target “A” zone (15”) at 100 yards.
100 Yard Total Average Deviation, Follow-On Test

The average table for 100 yards, for the Follow-On tests, shows a good level of precision in measurements for the top and bottom optic– meaning both testers saw nearly the same result. As with previous results, the rankings remain relatively constant.
100 Yard Total Average Deviation, All Tests

Looking at the combined test result table– we see the vast difference in possible aiming error between the optics models. However– rankings do remain relatively constant.
100 Yard % Change, Follow-On Test
100 Yard % Change, All Tests
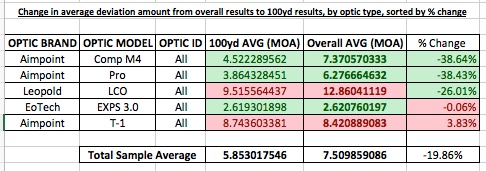
The 100 yard % change table is where we see a continuation of the general perceived notion that optics display less parallax at distance than at close range. With one exception– the AimPoint T-1 (in the Follow-On test table) and the EXPS 3.0 (in the combined result table), however the EXPS 3.0’s error amount was significantly less than the T-1’s.
One of the most significant aspects of the test is the comparison of the observed results, compared to the specific manufacturer’s claims as to the parallax characteristics of the optics. It should be noted that it is not made clear what aspect of parallax the manufacturer refers to in their product data. As parallax is defined as the apparent change of position of an object, viewed upon two different angles– it could refer to (in the case of this test) as to red dot movement or the actual target (viewing area) movement:
As we can see, there is a wide variance in what is claimed by the manufacturers and what is observed. All but Eotech, who over estimated error, failed to produce results that match the claims.
The intent of this testing effort was to raise the bar for what is expected by consumers in the industry. This by no means should be considered an exhaustive, complete, or irrefutable work. On the contrary, readers should endeavor to test their own equipment in this form (or a better way) to produce some form of reproducible data. Too often do we engage in hero worship, group think, of product fandom to drive our equipment selection or opinions. We should have a data driven approach to equipment analysis, this way our conversations and debates can be centered in fact– instead of emotion. Emotional attachments to equipment the blind following of fan groups breeds a toxic environment where substandard equipment is allowed to persist. It also diminishes our ability to demand performance from the equipment we purchase with our hard-earned money and prevents us, as a community, from progressing technology. My challenge to you: Get out and prove this test wrong, prove it right, I don’t care– just get out and collect data. Be part of the solution.
Aimpoint. (2017, June 15). Aimpoint Micro T-1. Retrieved June 15, 2017, from Aimpoing Official Website: http://www.aimpoint.com/product/aimpoint-micro-t-1/
Aimpoint. (2017, June 15). Aimpoint Micro T-2. Retrieved June 15, 2017, from Aimpoint Official Website: http://www.aimpoint.com/product/aimpoint-micro-t-2/
Aimpoint. (2017, June 15). CompM2. Retrieved June 15, 2017, from Aimpont Official Website: http://www.aimpoint.com/product/aimpointR-compm2/
Burris Optics. (2017, June 15). FastFire 3 | Burris Optics. Retrieved June 15, 2017, from Burris Optics Official Website: http://www.burrisoptics.com/sights/fastfire-series/fastfire-3
EoTech. (2017, June 15). Holographic Weapons Sights FAQ. Retrieved June 15, 2017, from Eotech Official Web Page:
Service, L. T. (2017, June 15). Leupold Carbine Optic (LCO). Retrieved June 15, 2017, from Leopold Official Website:
Trijicon. (2017, June 15). Trijicon MRO Patrol. Retrieved June 15, 2017, from Trijicon Official Website:
Trijicon. (2017, June 15). Trijicon SRS. Retrieved June 15, 2017, from Trijicon Official Website:
Vortex Optics. (2017, June 15). Razor Red Dots. Retrieved June 15, 2017, from Vortex Optics Official Website:
Vortex Optics. (2017, June 15). StrikeFire II Red Dots. Retrieved June 15, 2017, from Votex Optics Official Webpage:
This is by far the most carefully thought out, meticulously conducted firearms related study I have ever seen. This really sets a new and exciting standard for analysis of products in the firearms industry. If there is a peer reviewed journal for the firearms community, you should submit for publication.
Excellent and thorough study. This is something that many shooters have been suspecting, and you went out and got it done! Very helpful, thank you.
I would really appreciate getting the actual spreadsheets that you collected.
This is absolutely stellar work and honestly I hope that a standard gets developed for use in the industry so consumers can trust claims made by these manufacturers. I am an R+D engineer who’s worked in for two major medical device companies over the last 14 years and I have a ton of experience setting requirements for products.
The FDA calls these requirements “design inputs” and are usually derived based on what is known as a “user need”. A red dot would probably has a user need of “Reticle accurate within vital zone in typical engagement ranges” and a design input would be “Parallax error < 6" from 10-300y with reliability of 95%".
If the manufacturer has not done the work to interview users to establish the user need and input then typically what is done is known as "non-inferiority". This is where competitive products which have been successfully used in the field in the same use environment with the same user type and are measured like you've done. If manufacturer's for these products have made no claims as to something like parallax then what the manufacturer will do is make certain that their product has either the same parallax error as their competitors or less.
My guess is there's someone at EOTech who really knows what they're doing and has probably done exactly this. The reason I think that is because they are the only one to state a parallax error and the 14 MOA parallax error they state just so happens to be worst case parallax of any of the competitive products you measured in your study. It's the exact value I would choose for my non-inferiority design input based on the data you've generated.
In med device we don't typically state our design inputs because they are extremely difficult to develop and usually proprietary as they could help a new company develop a quality product which could compete with your product. The difference in med device though is we are not permitted to make claims like 'zero parallax' without backing it up or having an established standard.
So what these companies should be doing is either quantifying their parallax using an established ISO standard, removing claims like "no" or "zero" parallax, or make no claims whatsoever. Sorry for the long reply but wanted to give you some insight how med device typically handles stuff like this.